Instructions
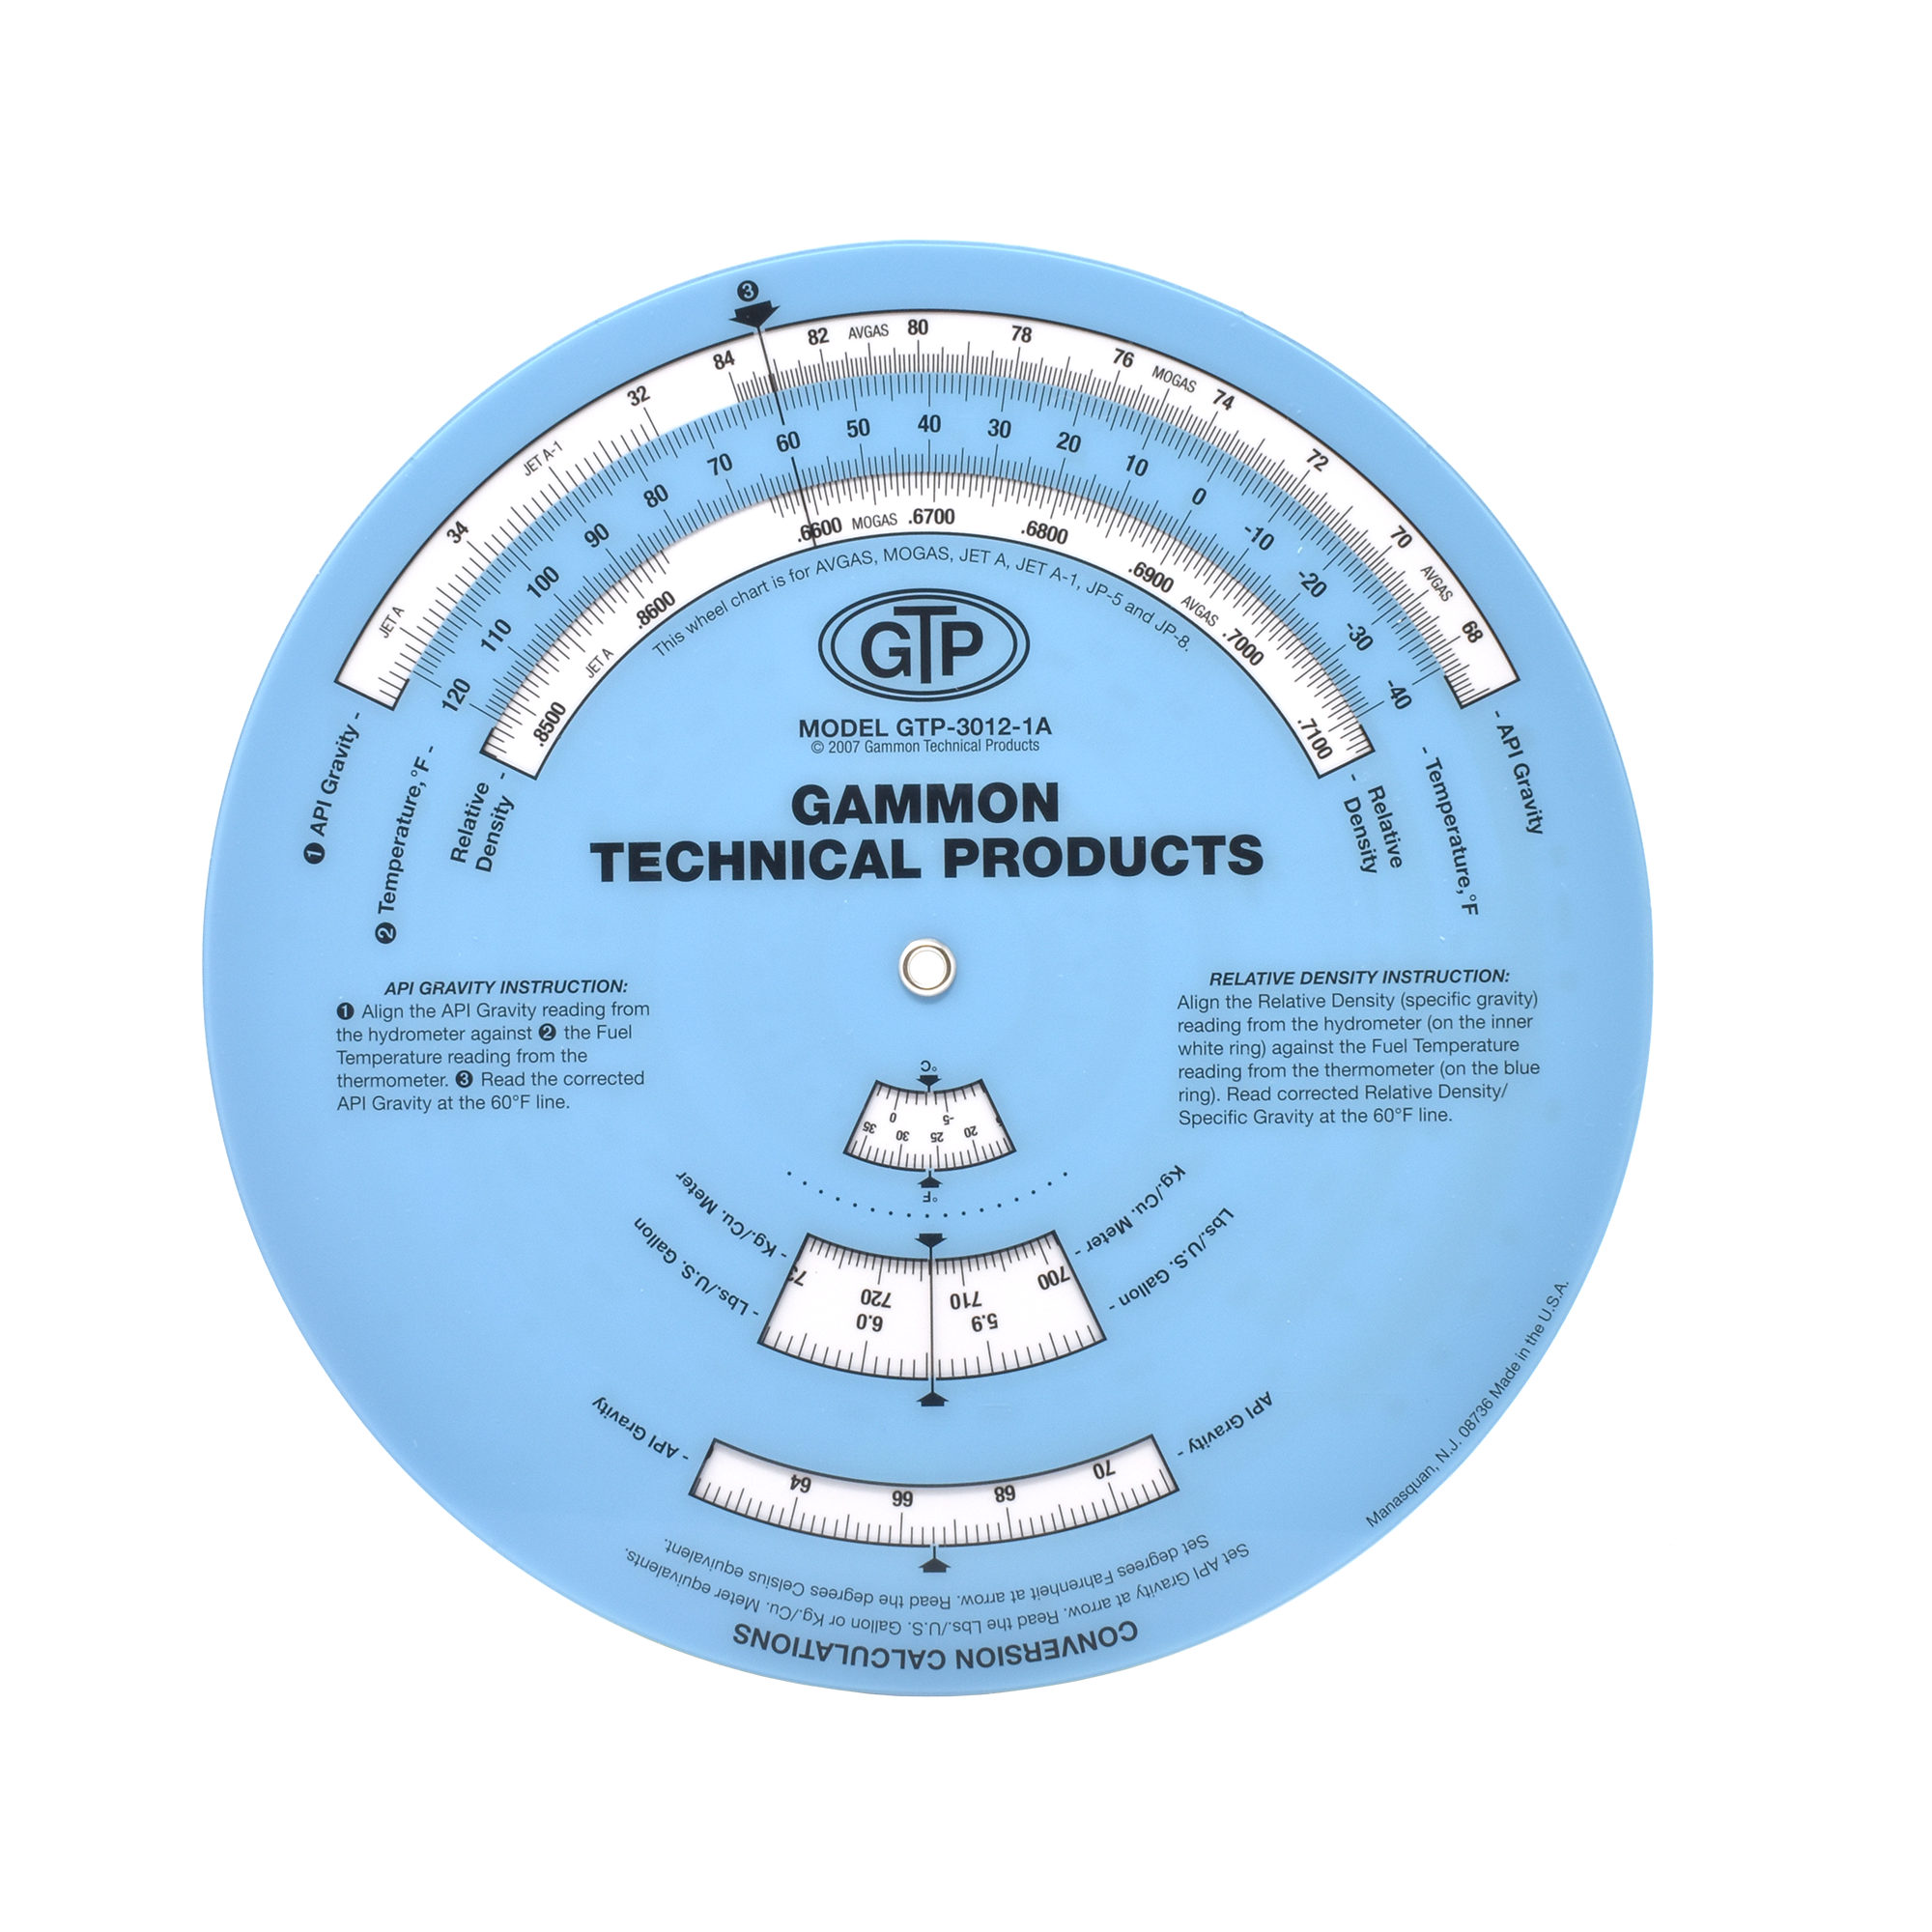
- Rotate the disk until the observed hydrometer reading (°API) is aligned with observed temperature (°F).
- Read the corrected °API at the 60°F arrow.
NOTE: If a relative density or specific gravity hydrometer is used, set the hydrometer reading opposite the observed temperature. Then read the corrected relative density at the 60°F arrow.
Results obtained with this calculator in the API gravity range from 48 to 51 (or a correction that goes through this range) cannot be compared to the printed tables because we have avoided error created by this transition zone (see Volume X of Petroleum Measurement Tables (D1250-80/IP200), pages X-73 to X-79). For jet fuels, we extended the curve upward using the original equation without entering the transition zone. For avgas, we extended the gasoline curve downward in the same manner. From a technical standpoint, our scales will yield more accurate results than the printed tables.

Instructions
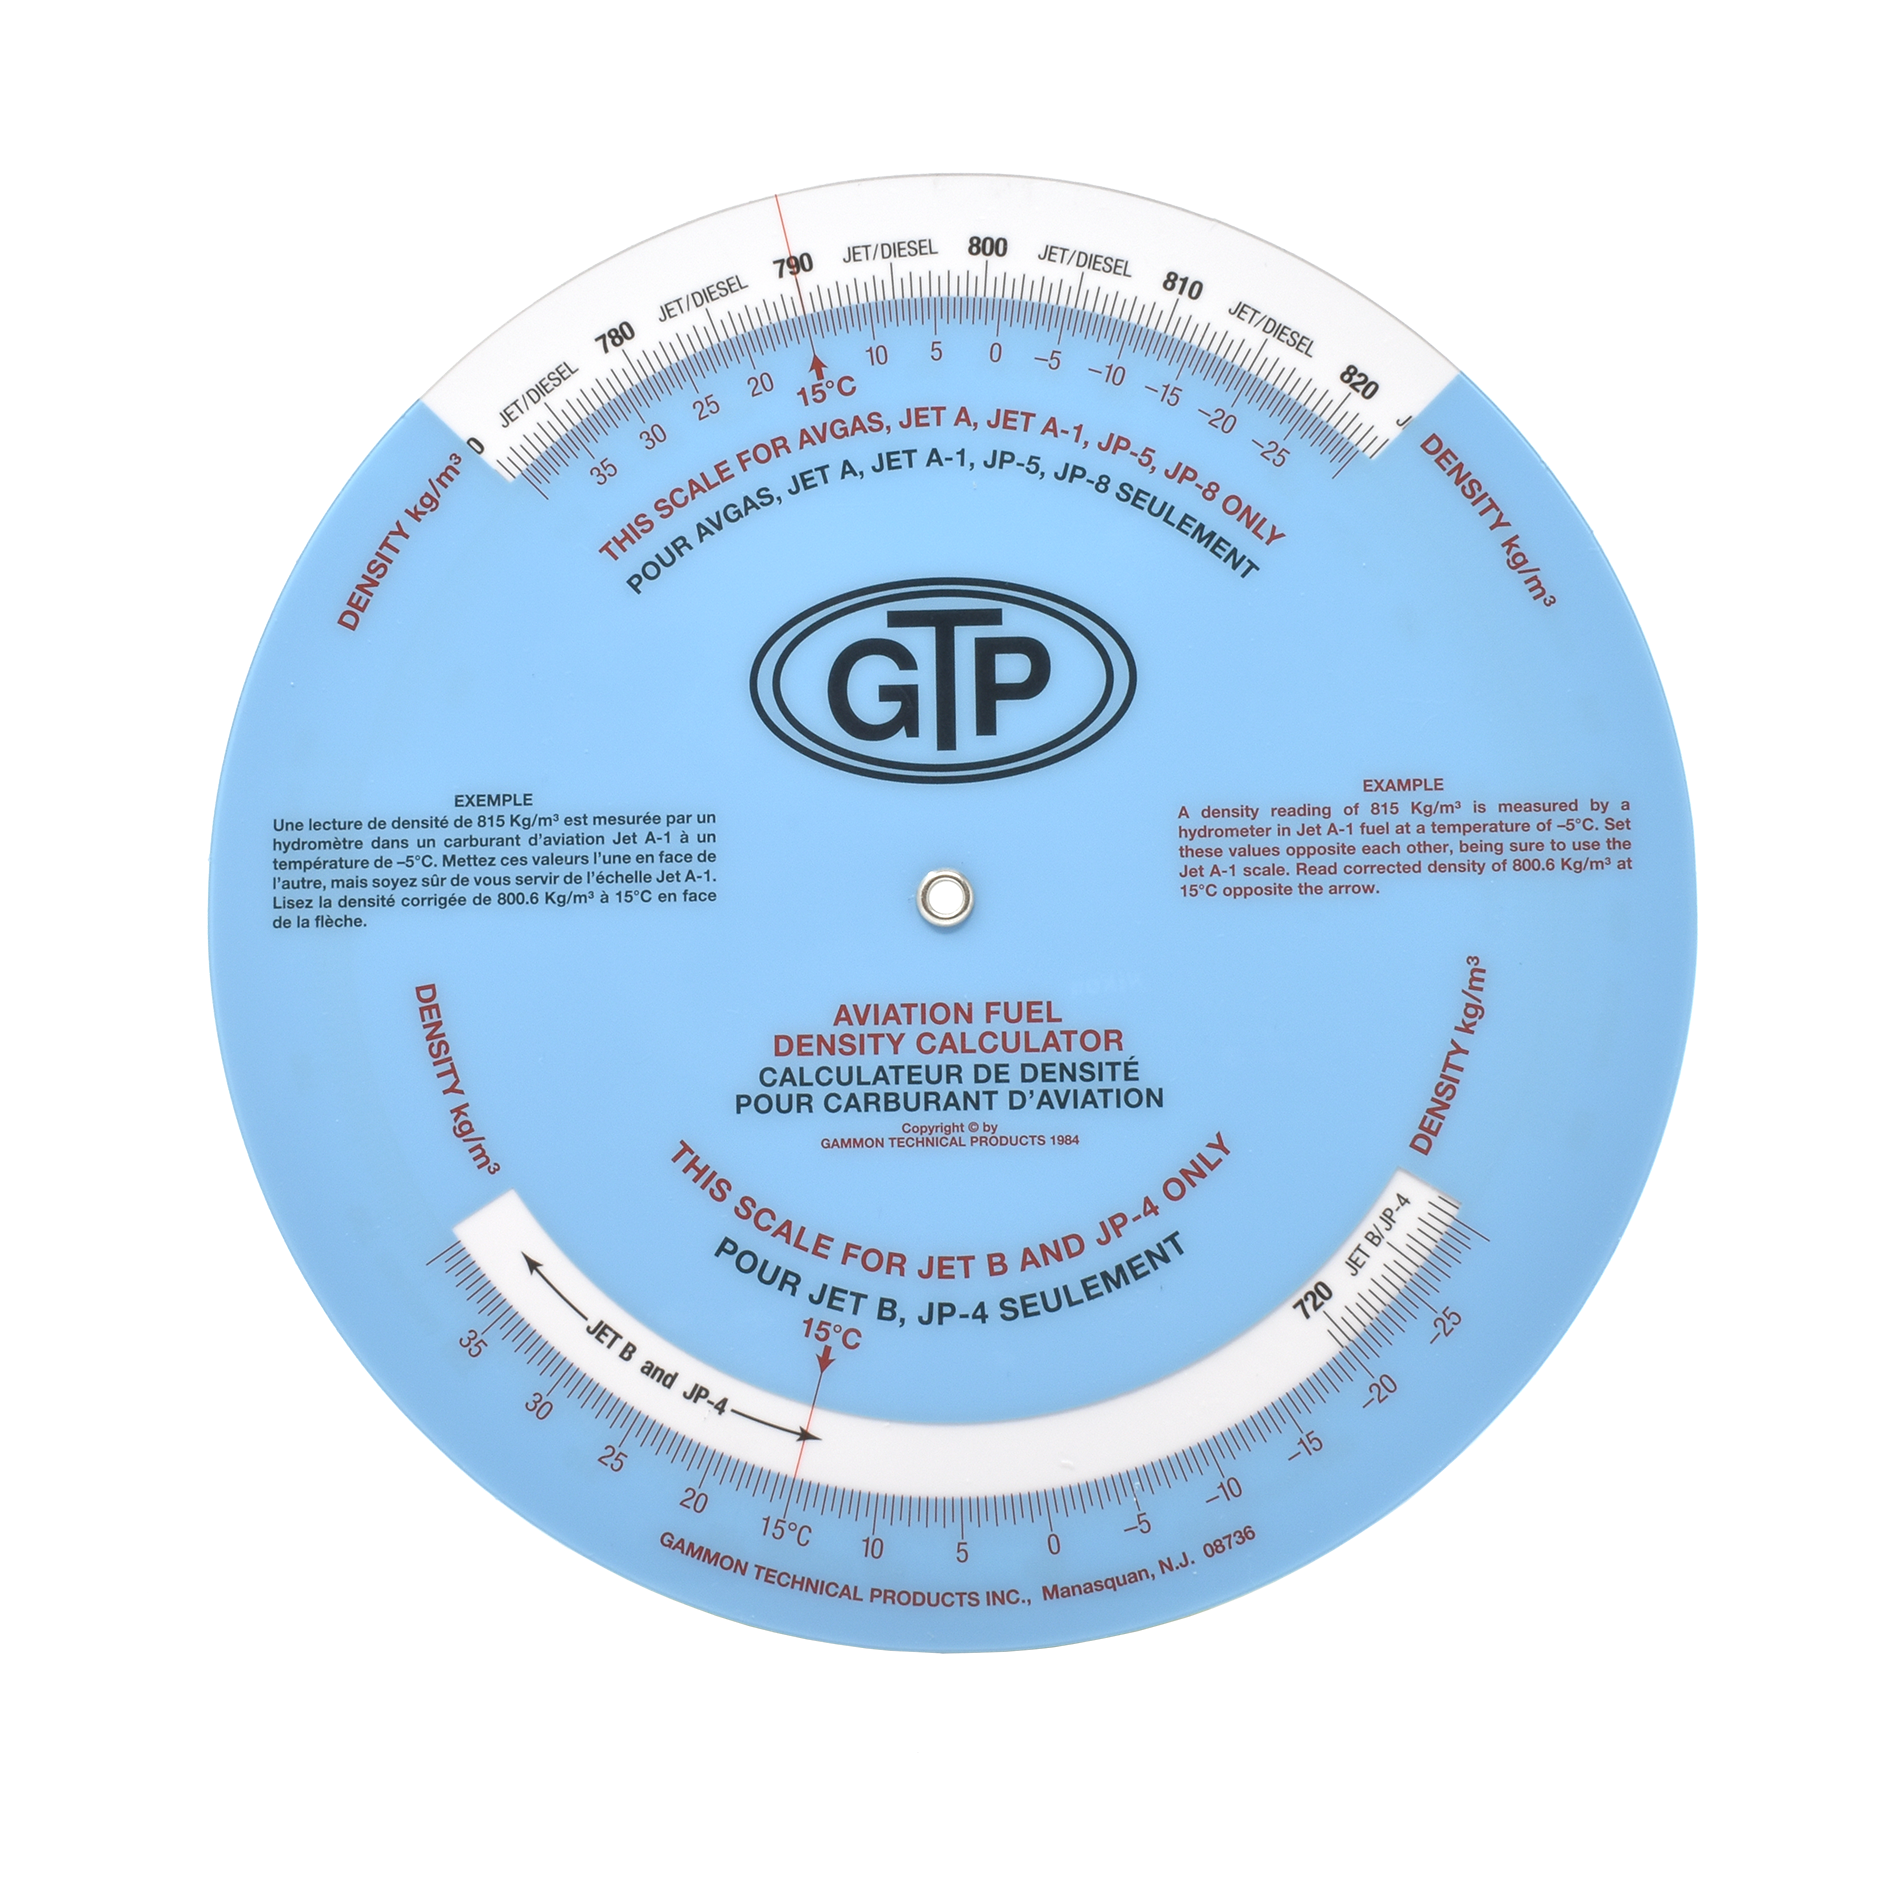
- Rotate the disk until the observed hydrometer reading is aligned with observed temperature.
- Read the corrected density at the 15°C arrow.
Results obtained with this calculator in the density range from 770 to 784 kg/m³ (or a correction that goes through this range) cannot be compared to the printed tables because we have avoided error created by this transition zone (see Volume X of Petroleum Measurement Tables (D1250-80/IP200), pages X-73 to X-79). For jet fuels, we extended the curve upward using the original equation without entering the transition zone. For avgas, we extended the gasoline curve downward in the same manner. From a technical standpoint, our scales will yield more accurate results than the printed tables.

